Upper Secondary
(age 14-16 years)
Resources for Upper Secondary

The resources listed on this page were designed for older school pupils. They cover concepts from topics in mathematics, geography, science and computing but many also include extension activities linked to other curriculum areas.
You may also find the lower-secondary or Post-16 materials useful for some topics.
What can we see from space?
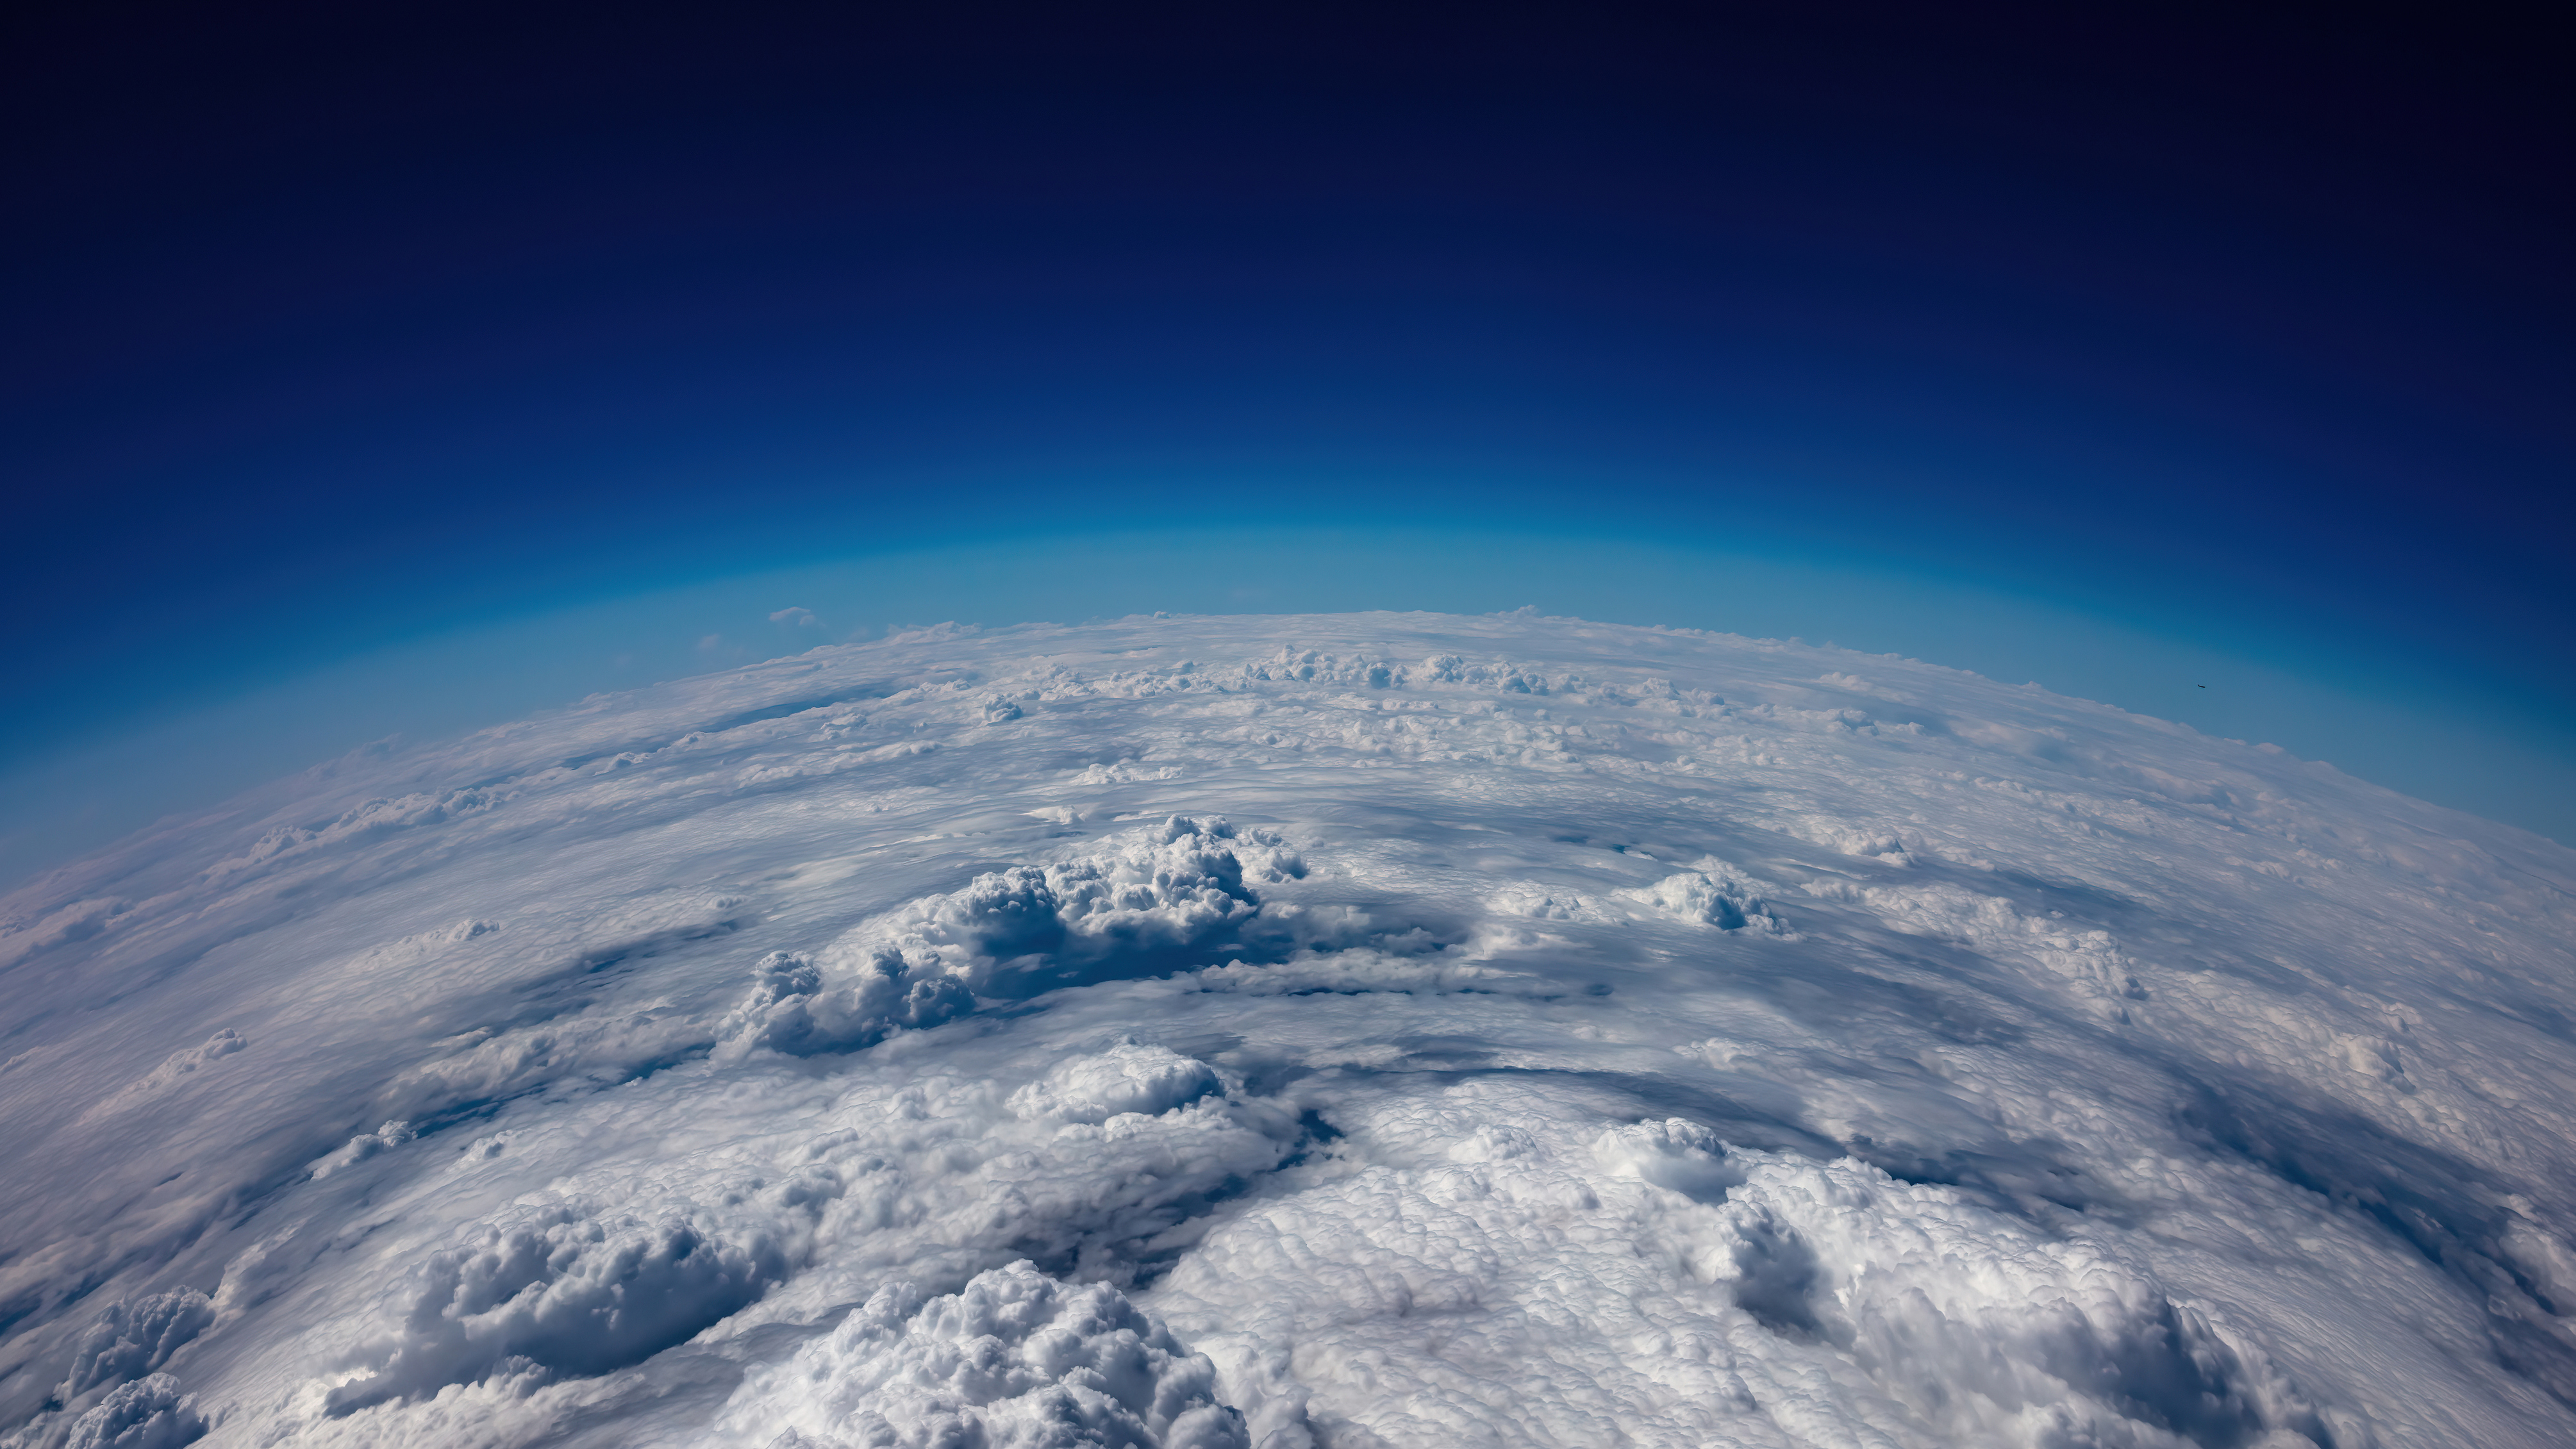
This short activity introduces students to the ideas of the footprint and resolution of an image, asking them to choose and use appropriate methods to calculate how these quantities would change as they moved a camera to a series of vantage points above the surface of the Earth. There is an optional practical component.
Pack includes: worksheet (versions with and without sample data), PowerPoint presentation, teacher guide.
Download from: STEM Learning | What can we see from space?
Seeing temperatures
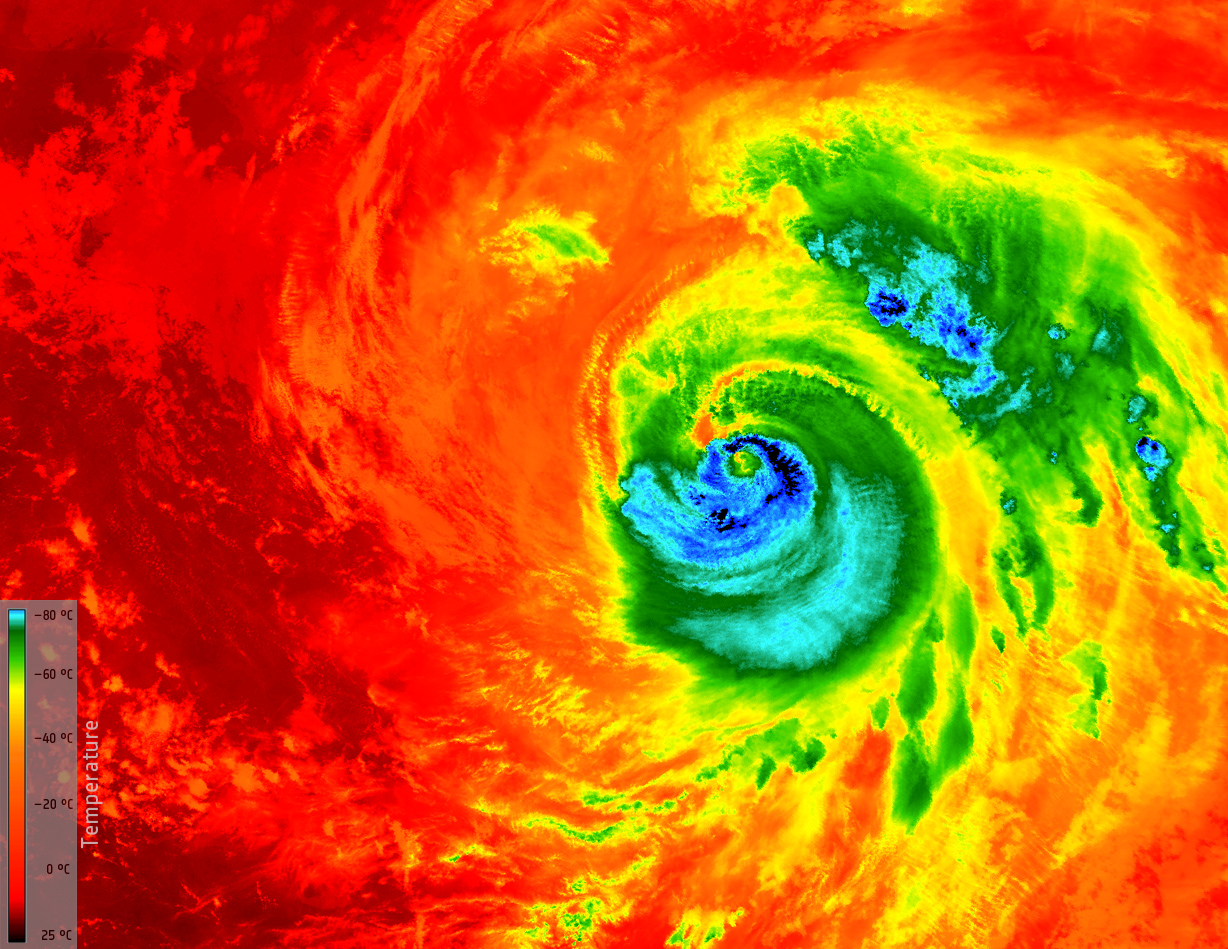
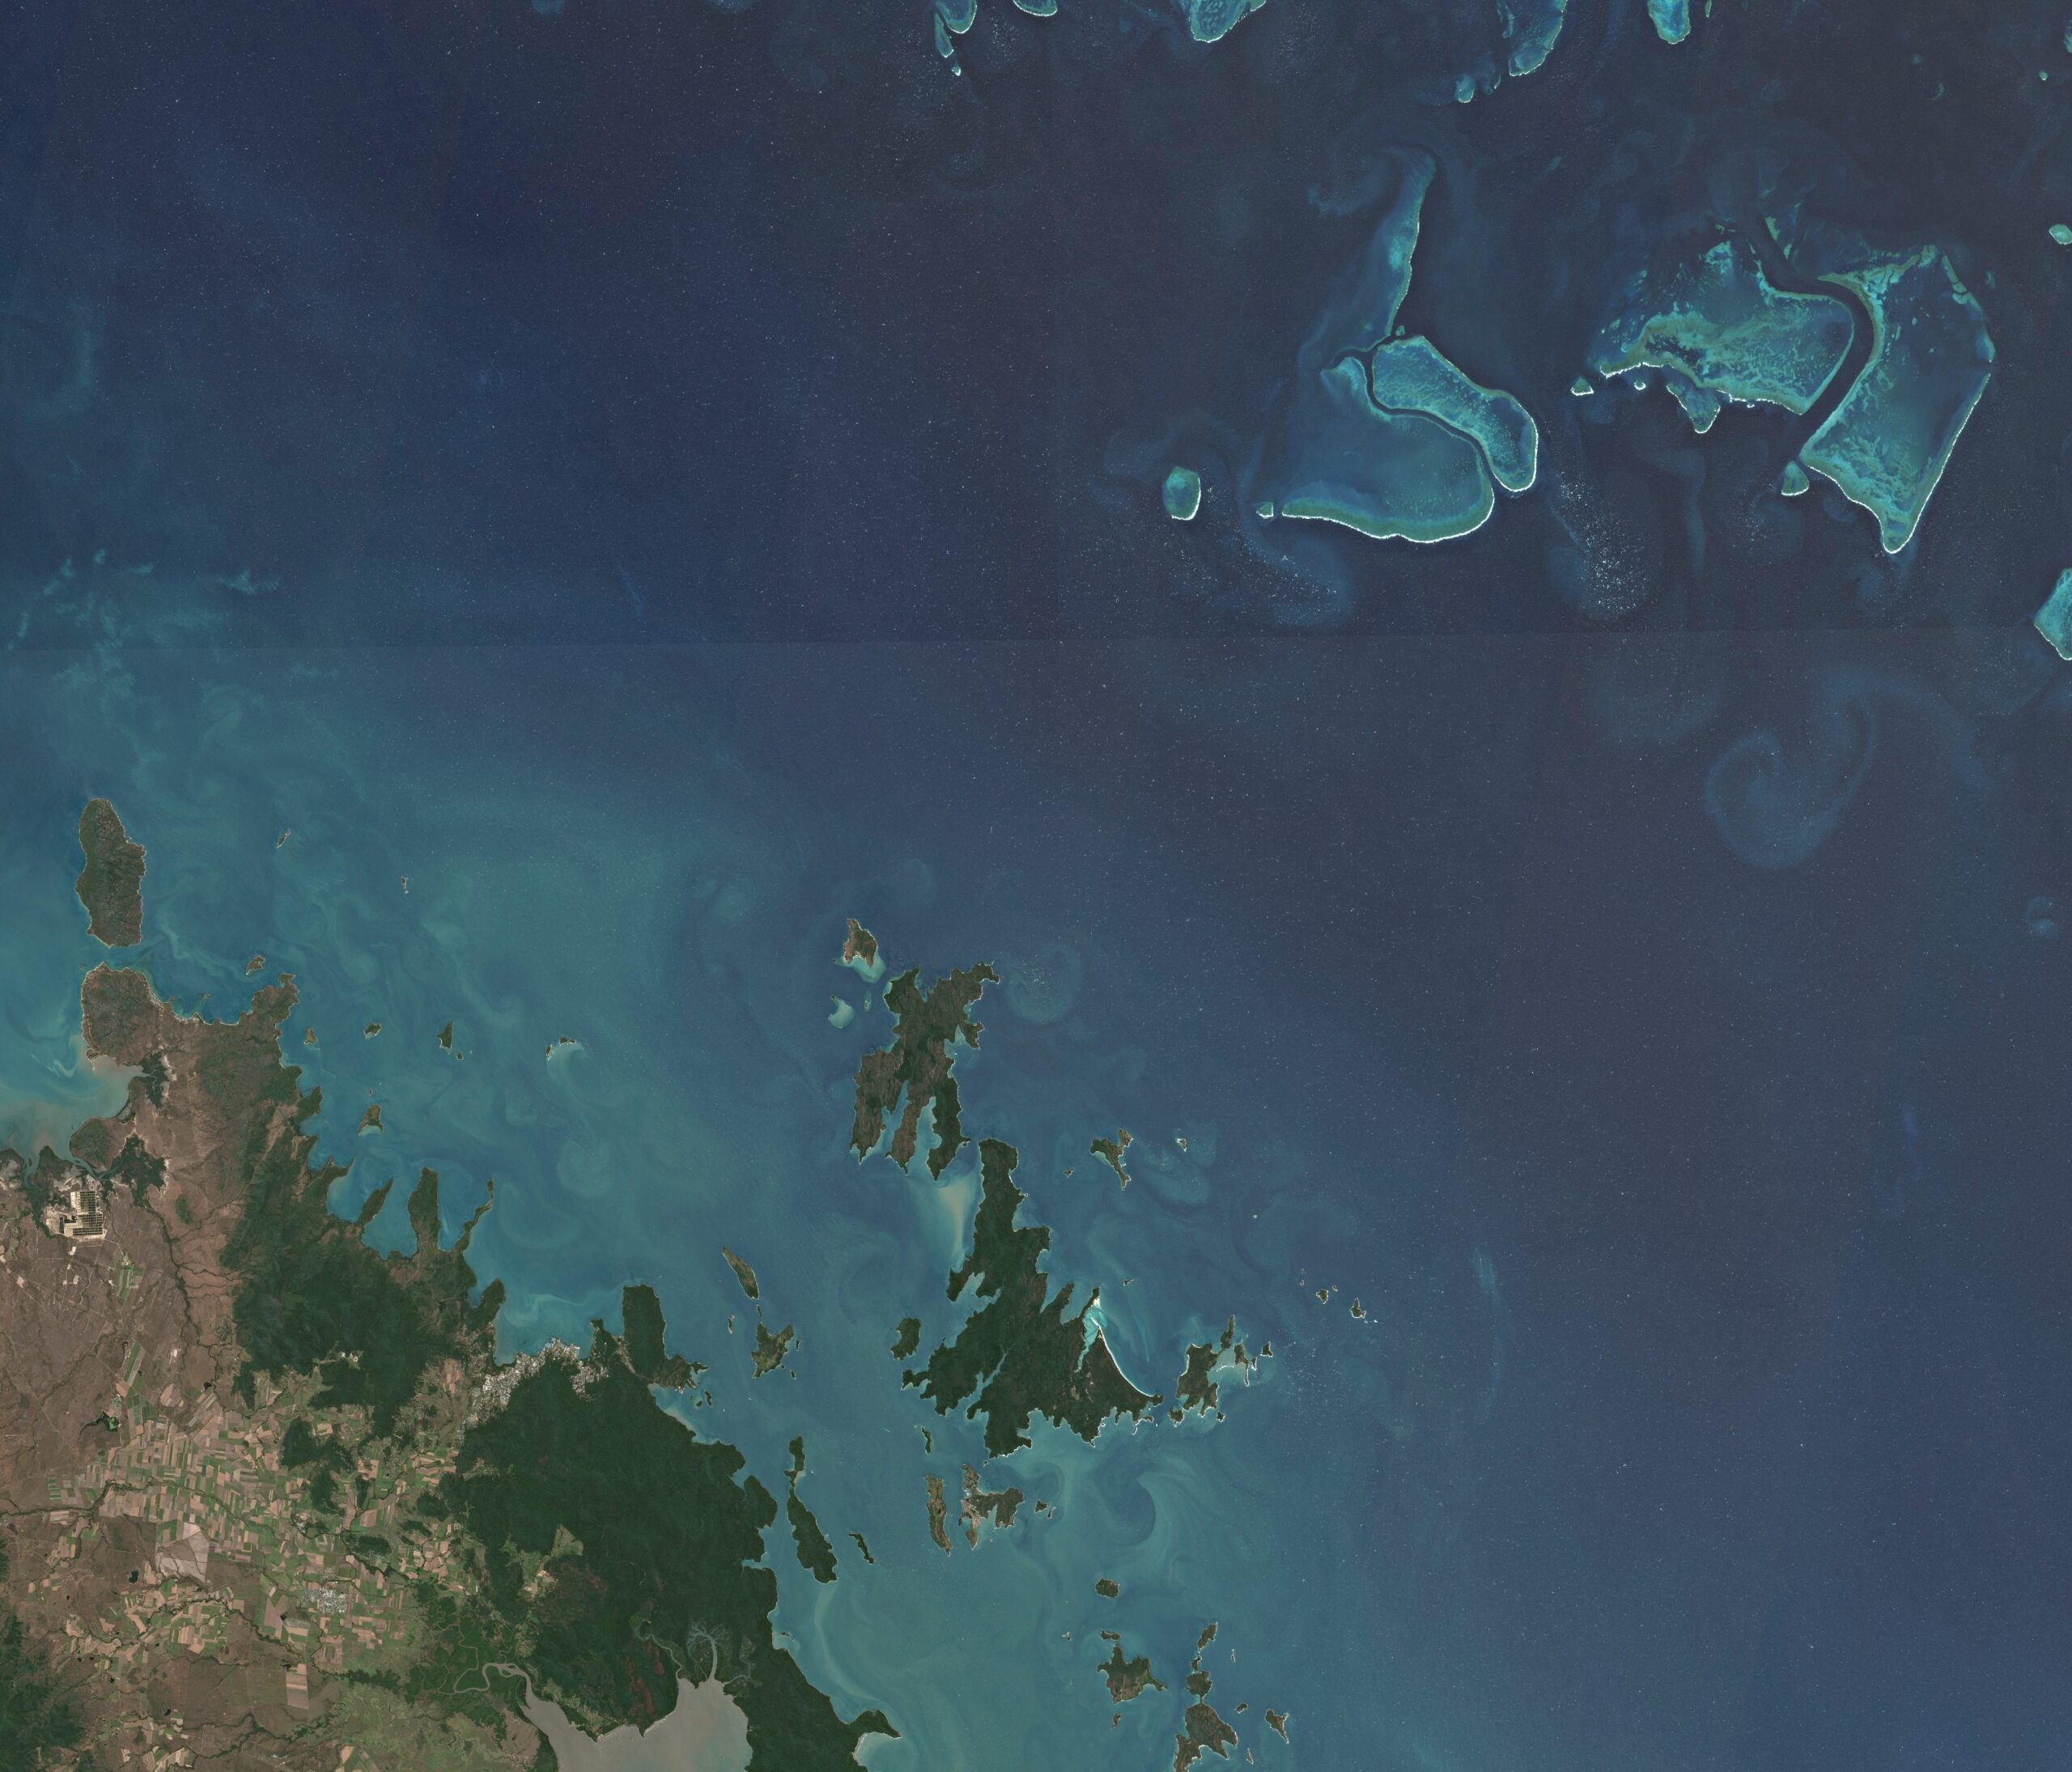
This activity allows students to investigate how images are produced from a single data stream and how the usefulness of these images may be enhanced by using lookup tables and calibration.
Although the instructions are based on the use of Excel and ImageJ (a free Java-based image-processing program that is widely used by astronomers and medical researchers as well as EO scientists), they can easily be adapted to work with other software. The materials used focus on the thermal infra-red allowing discussion of the electromagnetic spectrum and, for older students, black-body radiation.
Pack includes: worksheet (in versions with and without supporting information), a data set (csv file), four raw images for processing, PowerPoint presentation, teacher guide
Download from: STEM Learning | Seeing temperatures
Building images
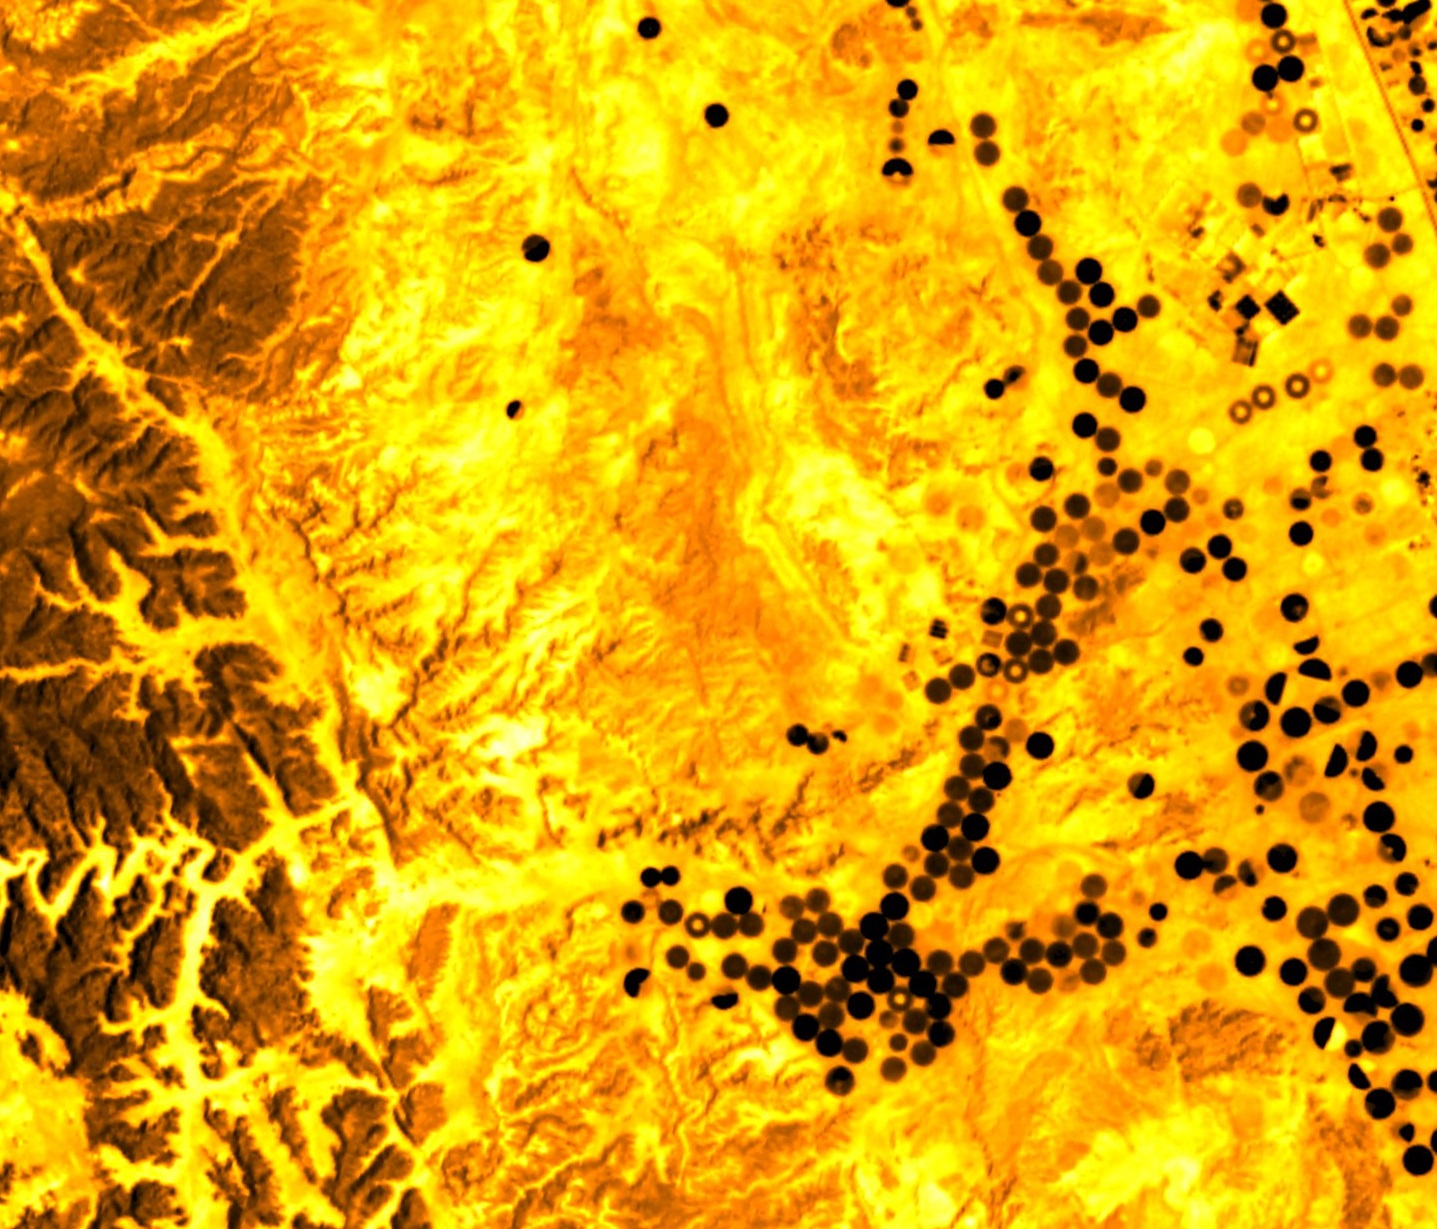
In this activity, students create colour images from satellite data to explore how different surfaces reflect different wavelengths of light, how coloured images are created using an RGB model, and how band combinations can be chosen to examine a particular landscape effectively.
The instructions are based on the use of ImageJ (see above), but can be adapted to work with other image-processing software. A version of this activity in the ESA climate office Taking the pulse of the planet resource aimed at students aged 11–14 uses a website that allows satellite data to be directly manipulated in this way.
Pack includes: worksheet, image for analysis, five data packs for processing (each pack contains 7 data sets in the form of images and is available in both full and low-resolution formats), PowerPoint presentation, teacher guide
Download from: STEM Learning | Seeing temperatures
Where would you photograph?
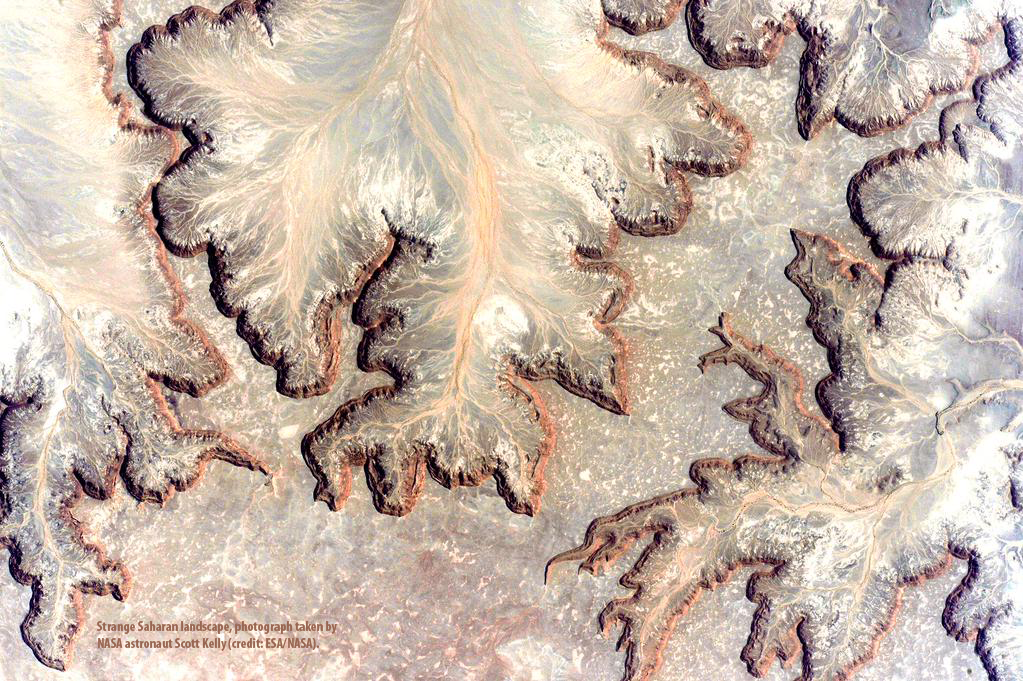
In this activity, students take on the role of Earth observation scientists submitting a request for an image they would like for their research. This gives them the opportunity to consider the possibilities of pictures taken from orbit (and the limitations) and to write scientifically for a specific audience. It can be used to consolidate learning from the other resources or for an in-class or whole-school competition.
Pack includes: worksheet, sample response, information sheet, PowerPoint presentation, certificate, teacher guide including science background
Download from: STEM Learning | Where would you photograph? (14–16)
Taking the pulse of the planet (14–16)
This ESA Climate office resource pack allows students to learn about how data can be collected by sensors and how the orbit of satellites affect the details that can be obtained. It includes an extended version of the What can we see from space? activity above as well as a text-based exercise exploring the uses of Earth observation satellites in different orbits and carrying different sensors. Students are also supported to use real global data in ESAs ‘Climate from Space’ web application to explore the formation and impacts of El Niño and La Niña.
Pack includes: 3 worksheets, information sheet, teacher guide including science background
Download from: STEM Learning | Where would you photograph? (14–16)
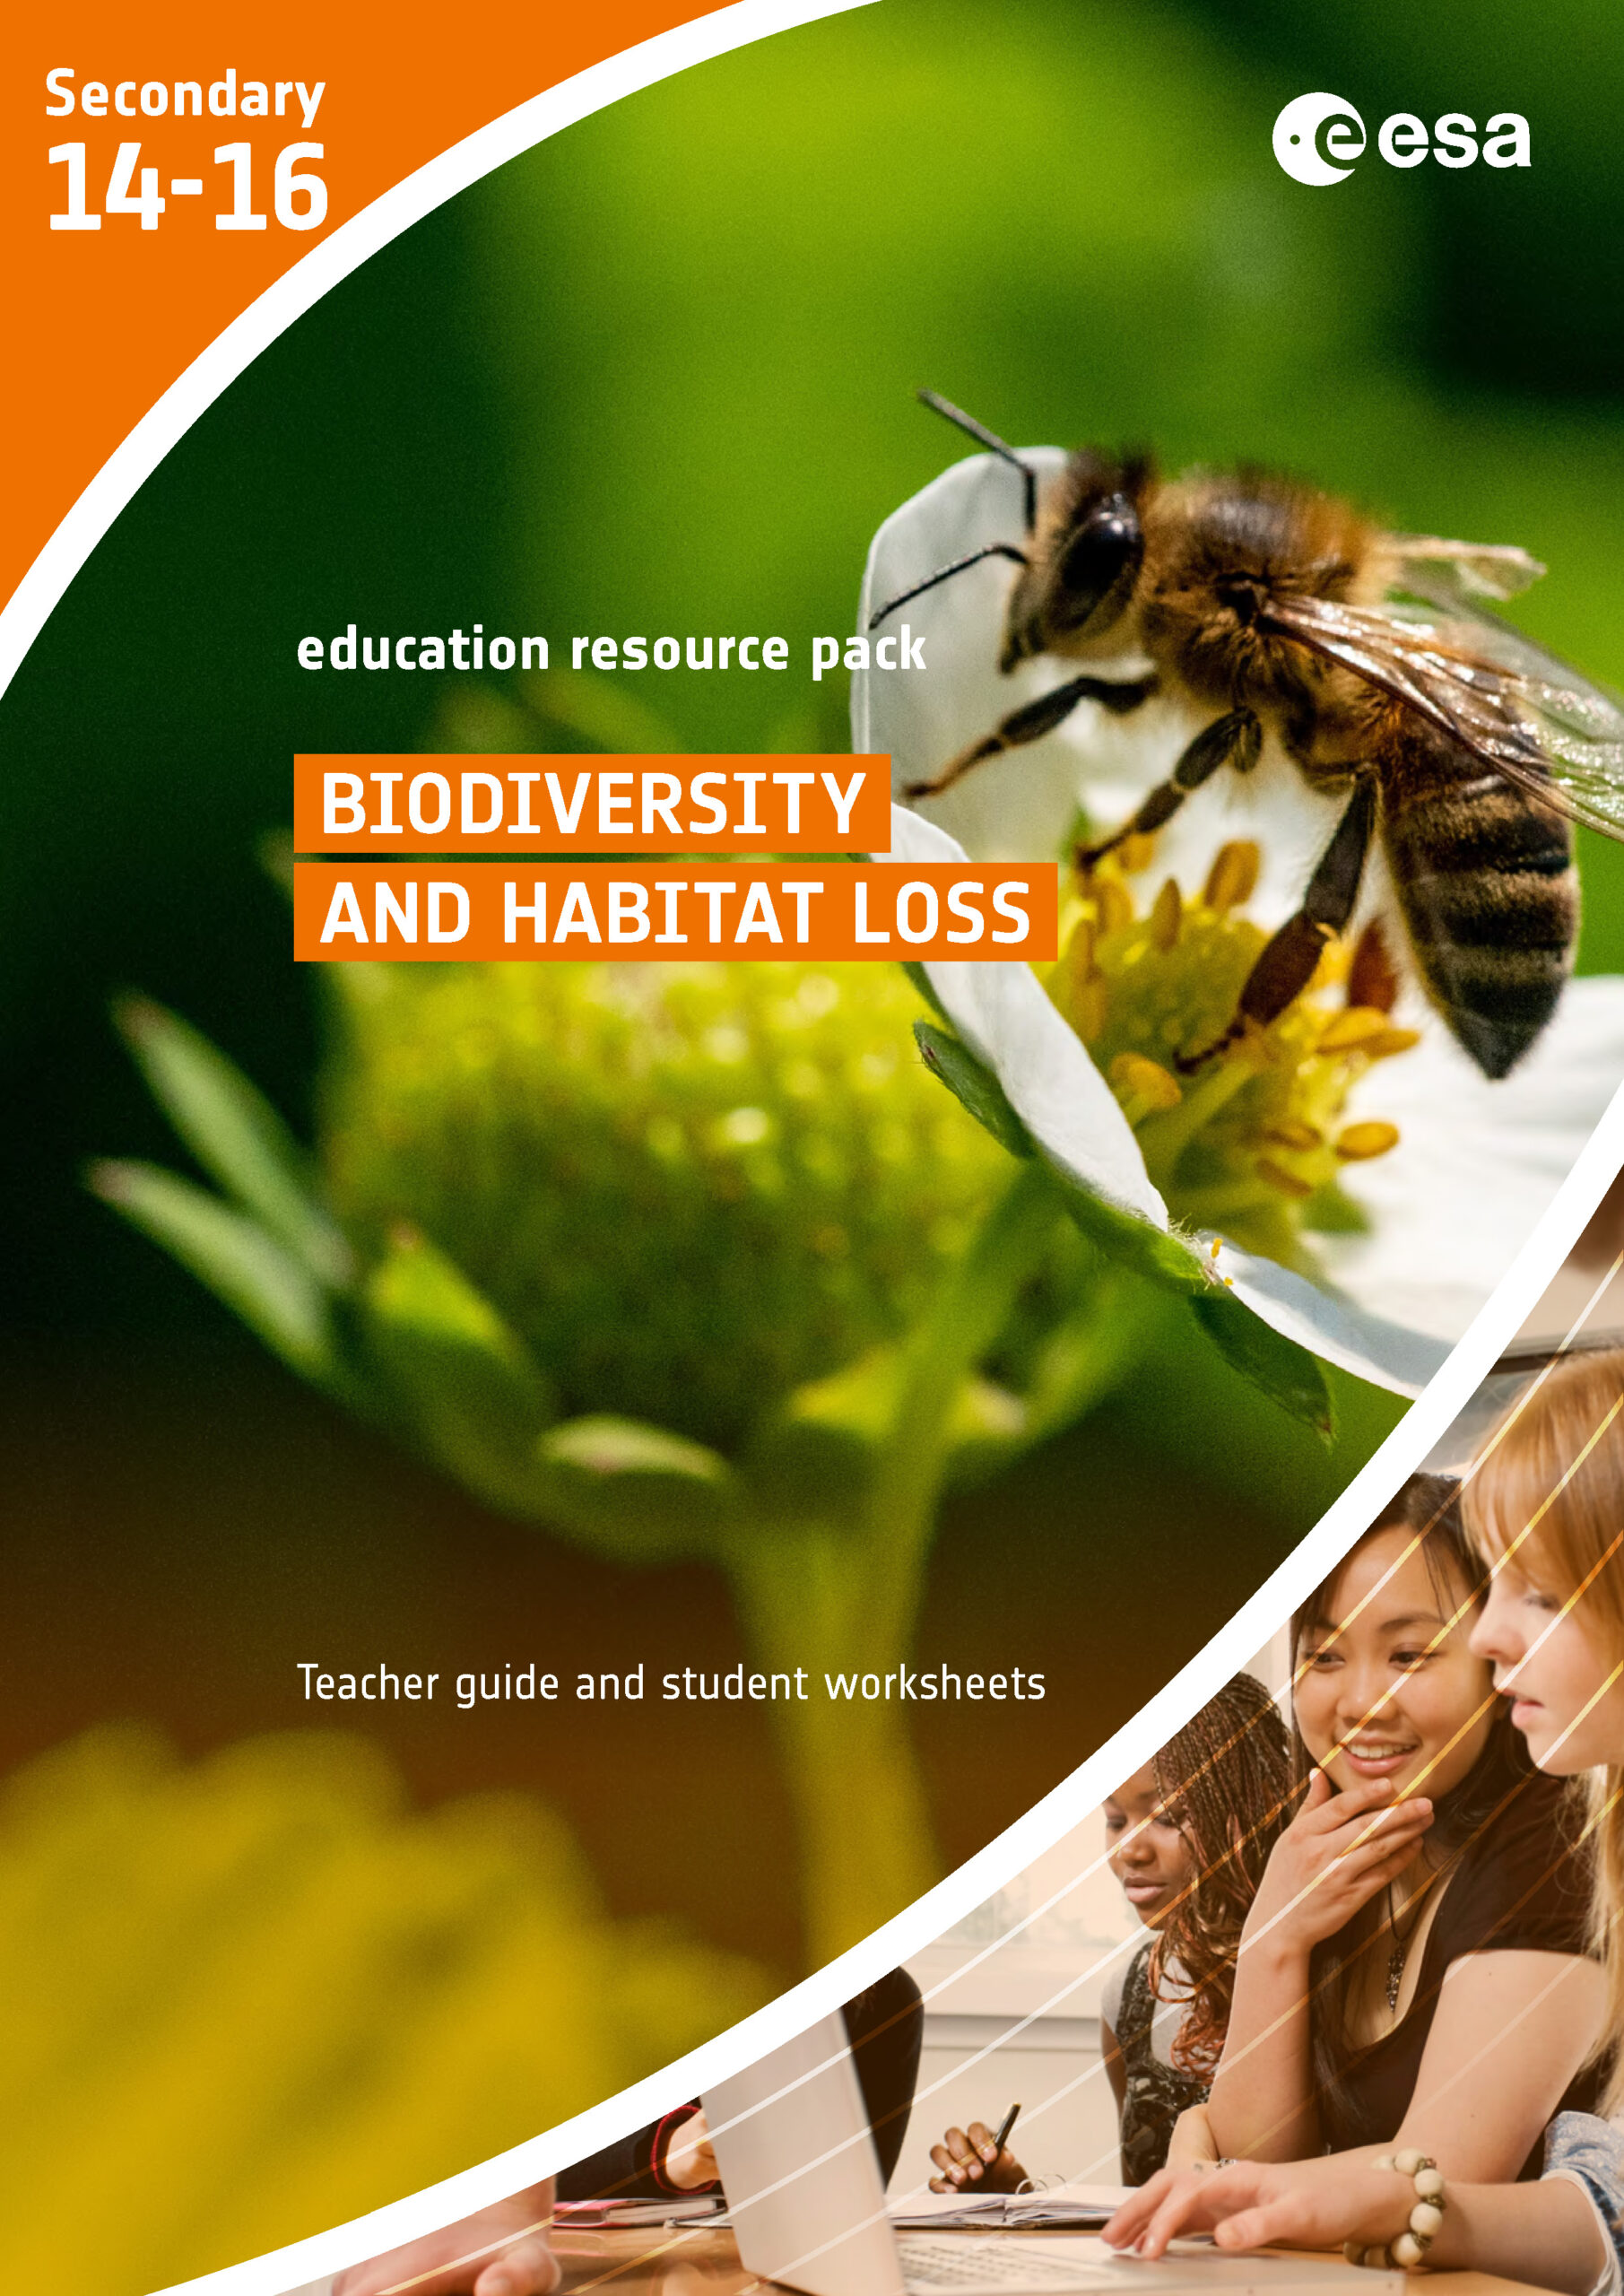
Biodiversity and habitat loss
This resource from the ESA Climate office explores how habitat loss affects biodiversity loss occurring today. In a series of activities, students:
- Create their own definitions for key list of key terms.
- Extend a standard survey (using quadrats) to calculate a biodiversity index and compare different parts of a site.
- Use real climate data in the ‘Climate from Space web application to evaluate the potential impact of habitat changes on a local species.
Pack includes: 3 worksheets, information sheet, spreadsheet to support measurement of biodiversity, teacher guide including science background
Download from: STEM Learning | Biodiversity and habitat loss
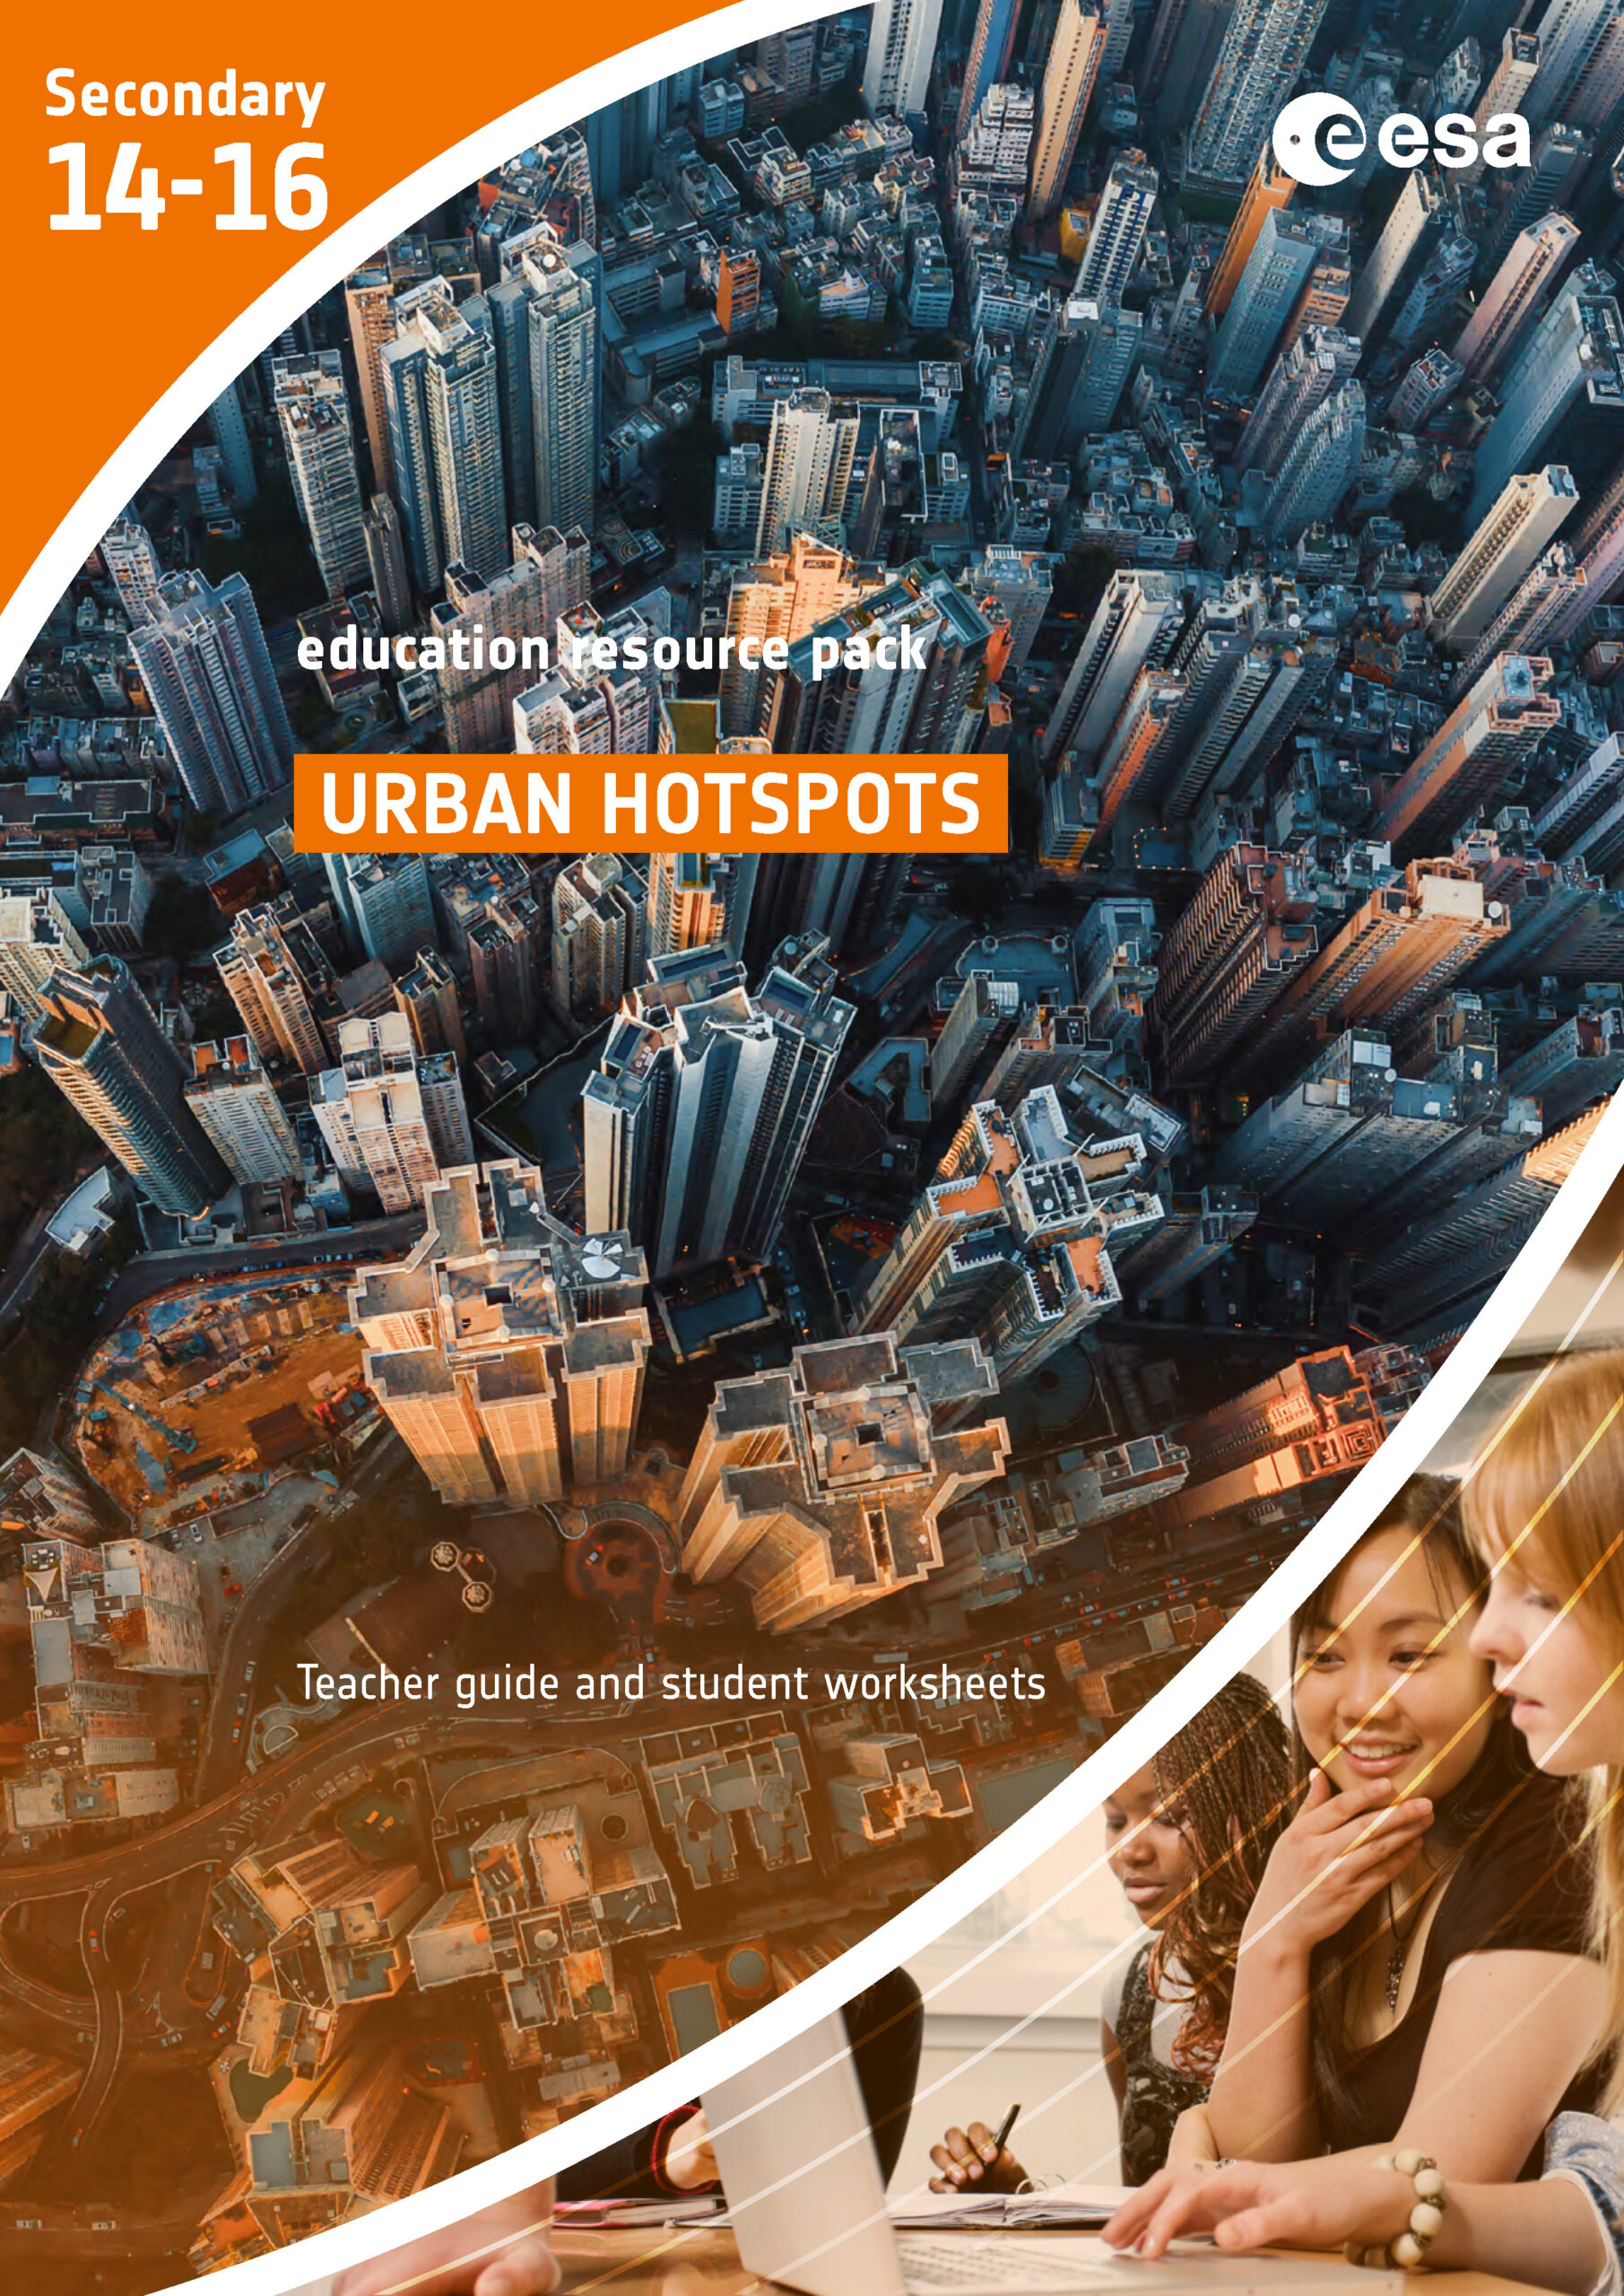
Urban hotspots
The activities in this pack from the ESA Climate office allow students to apply their understanding of heat transfer to explore the effect of the built environment on temperature through reading, mathematical modelling and the use of real data in satellite imagery, numerical data sets, photographs and maps. When using this resource, do look at the work of our land surface temperature group <please add link to appropriate website page> as this may well include some relevant UK imagery that you could use instead of or as well as that in the pack.
Pack includes: 3 worksheets, information sheets, spreadsheet to support calculations, temperature data, teacher guide including science background
Download from: STEM Learning | Biodiversity and habitat loss
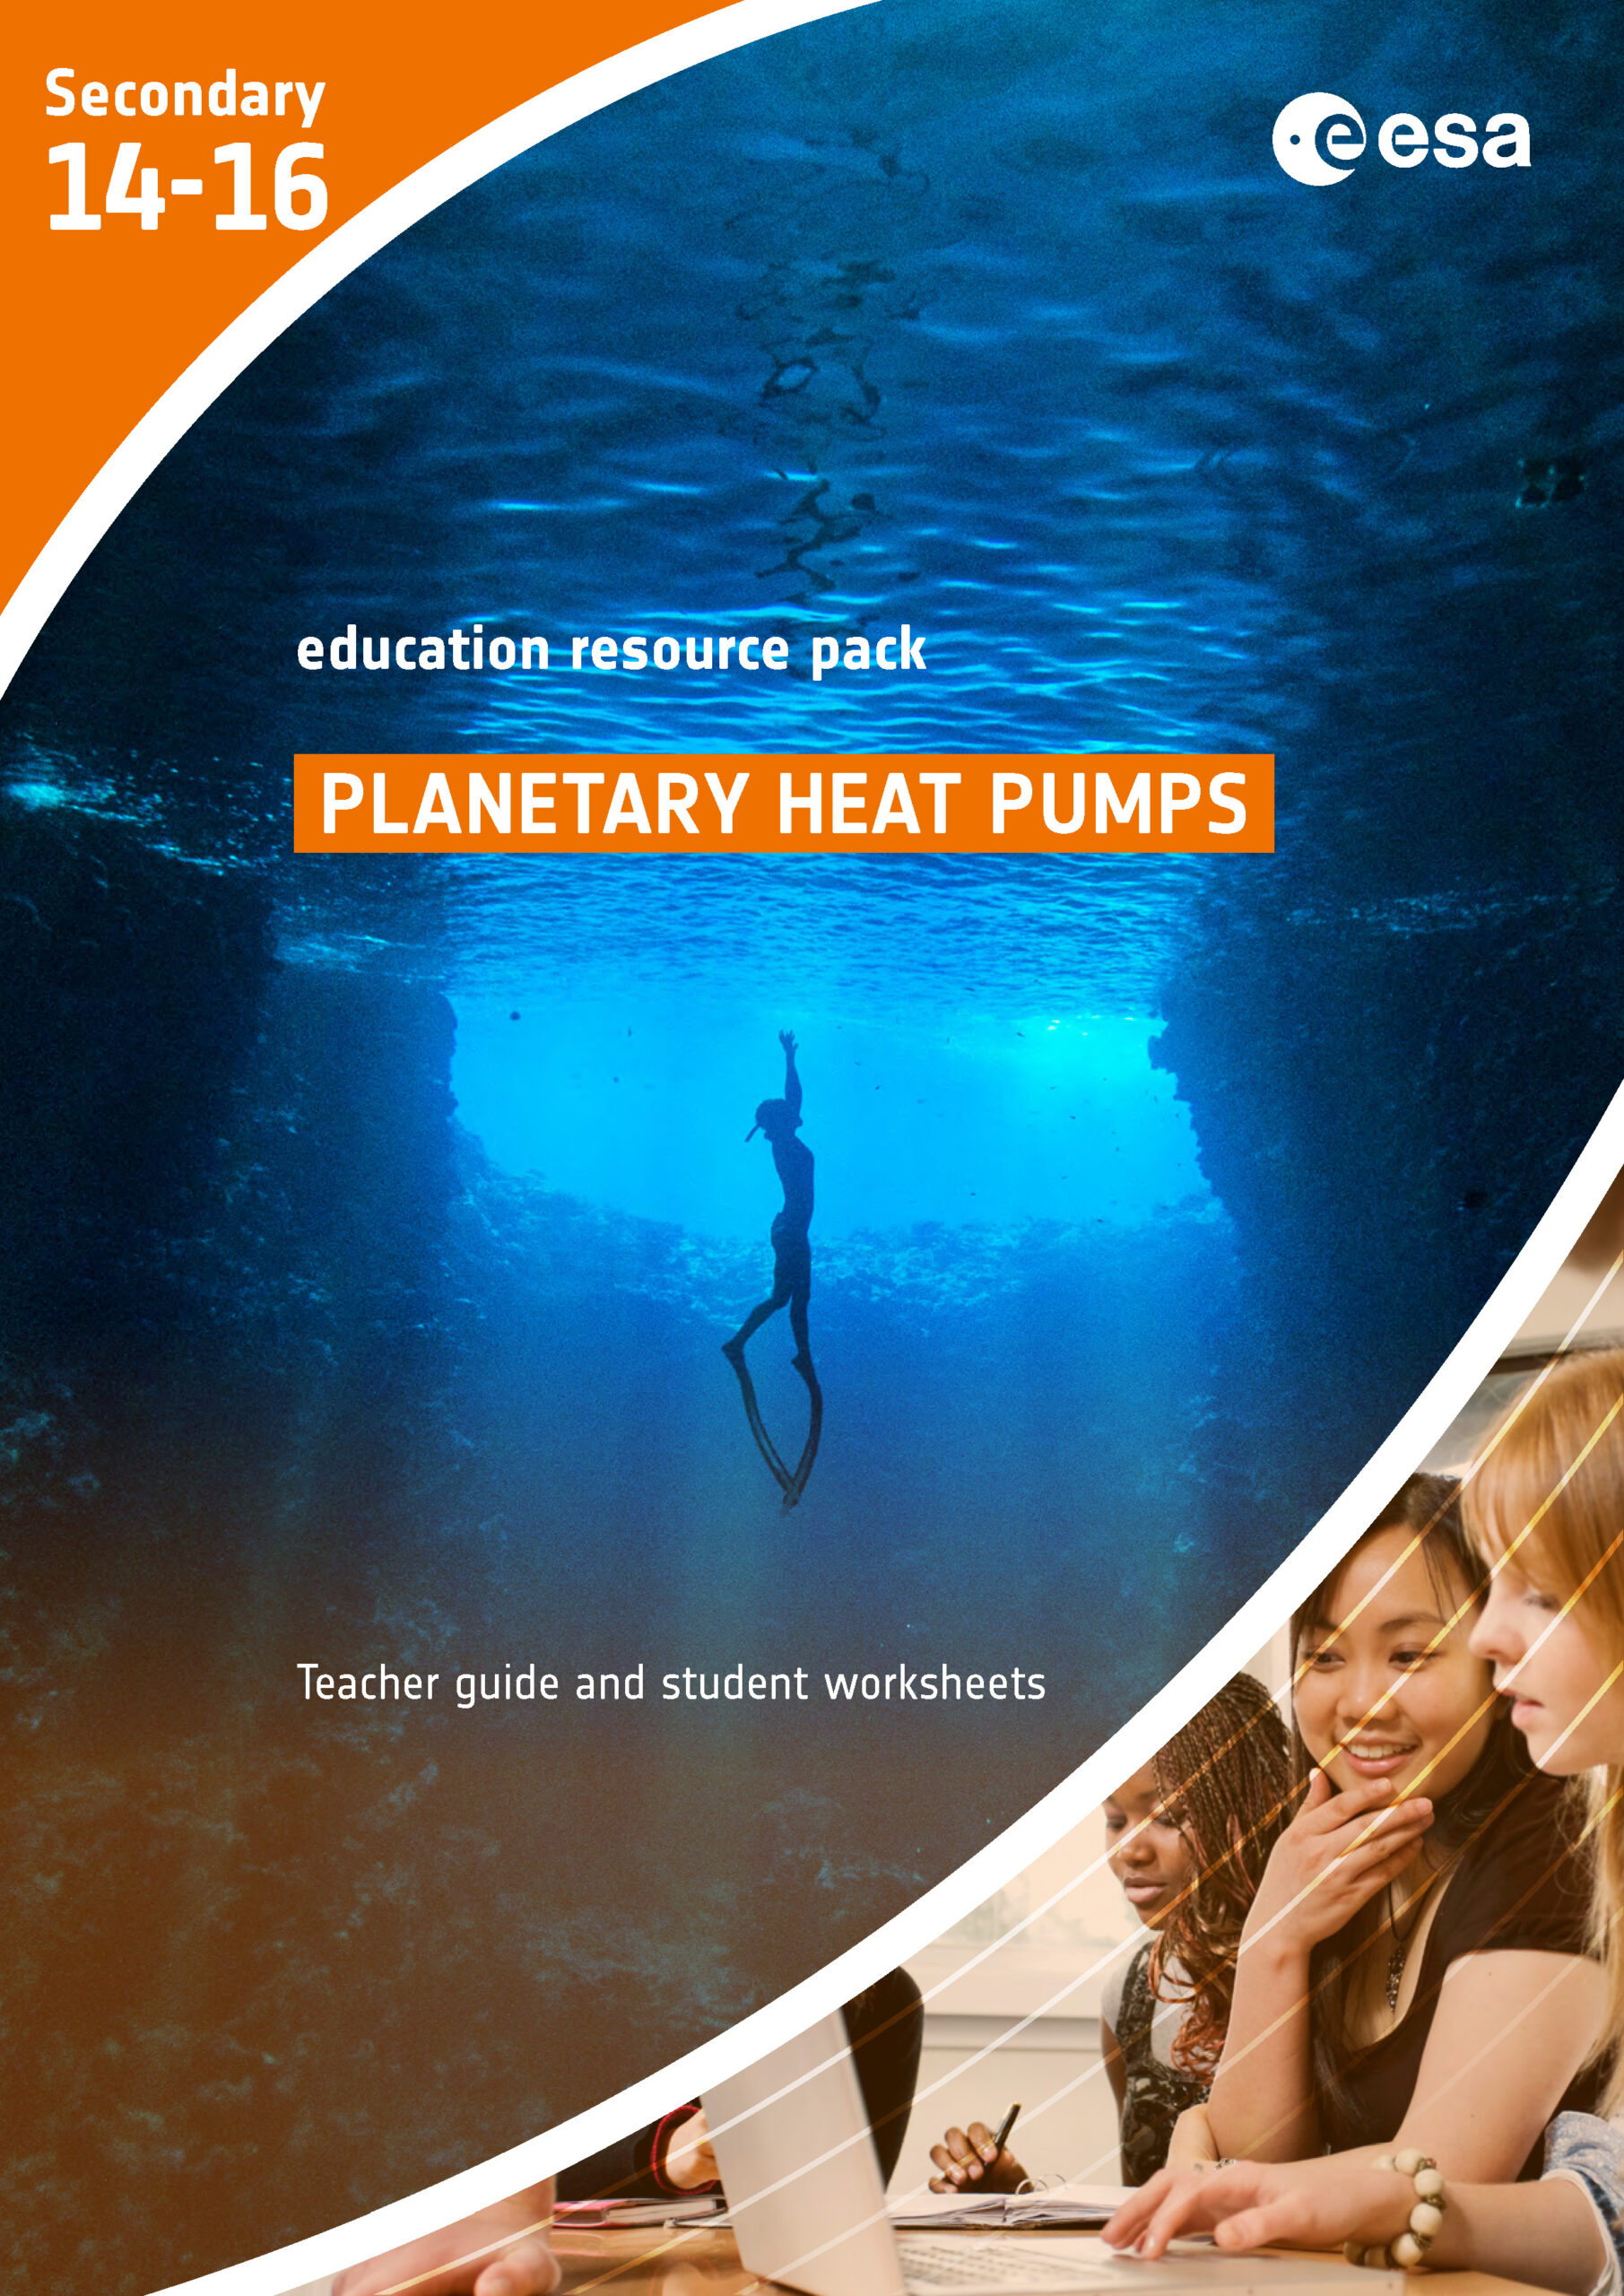
Planetary heat pumps
The ocean plays a key role in regulating global temperatures and is a driver of weather patterns across the world. This resource pack from the ESA Climate office uses the physics of the ocean as a context for activities related to specific heat capacity, density and working scientifically. Students have the opportunity to apply these ideas to analyse real climate data related to the Gulf Stream. All activities can be carried out independently or in groups and are also suitable for home learning.
Pack includes: 3 worksheets, information sheet, temperature data (spreadsheet), teacher guide
Download from: STEM Learning | Planetary heat pumps
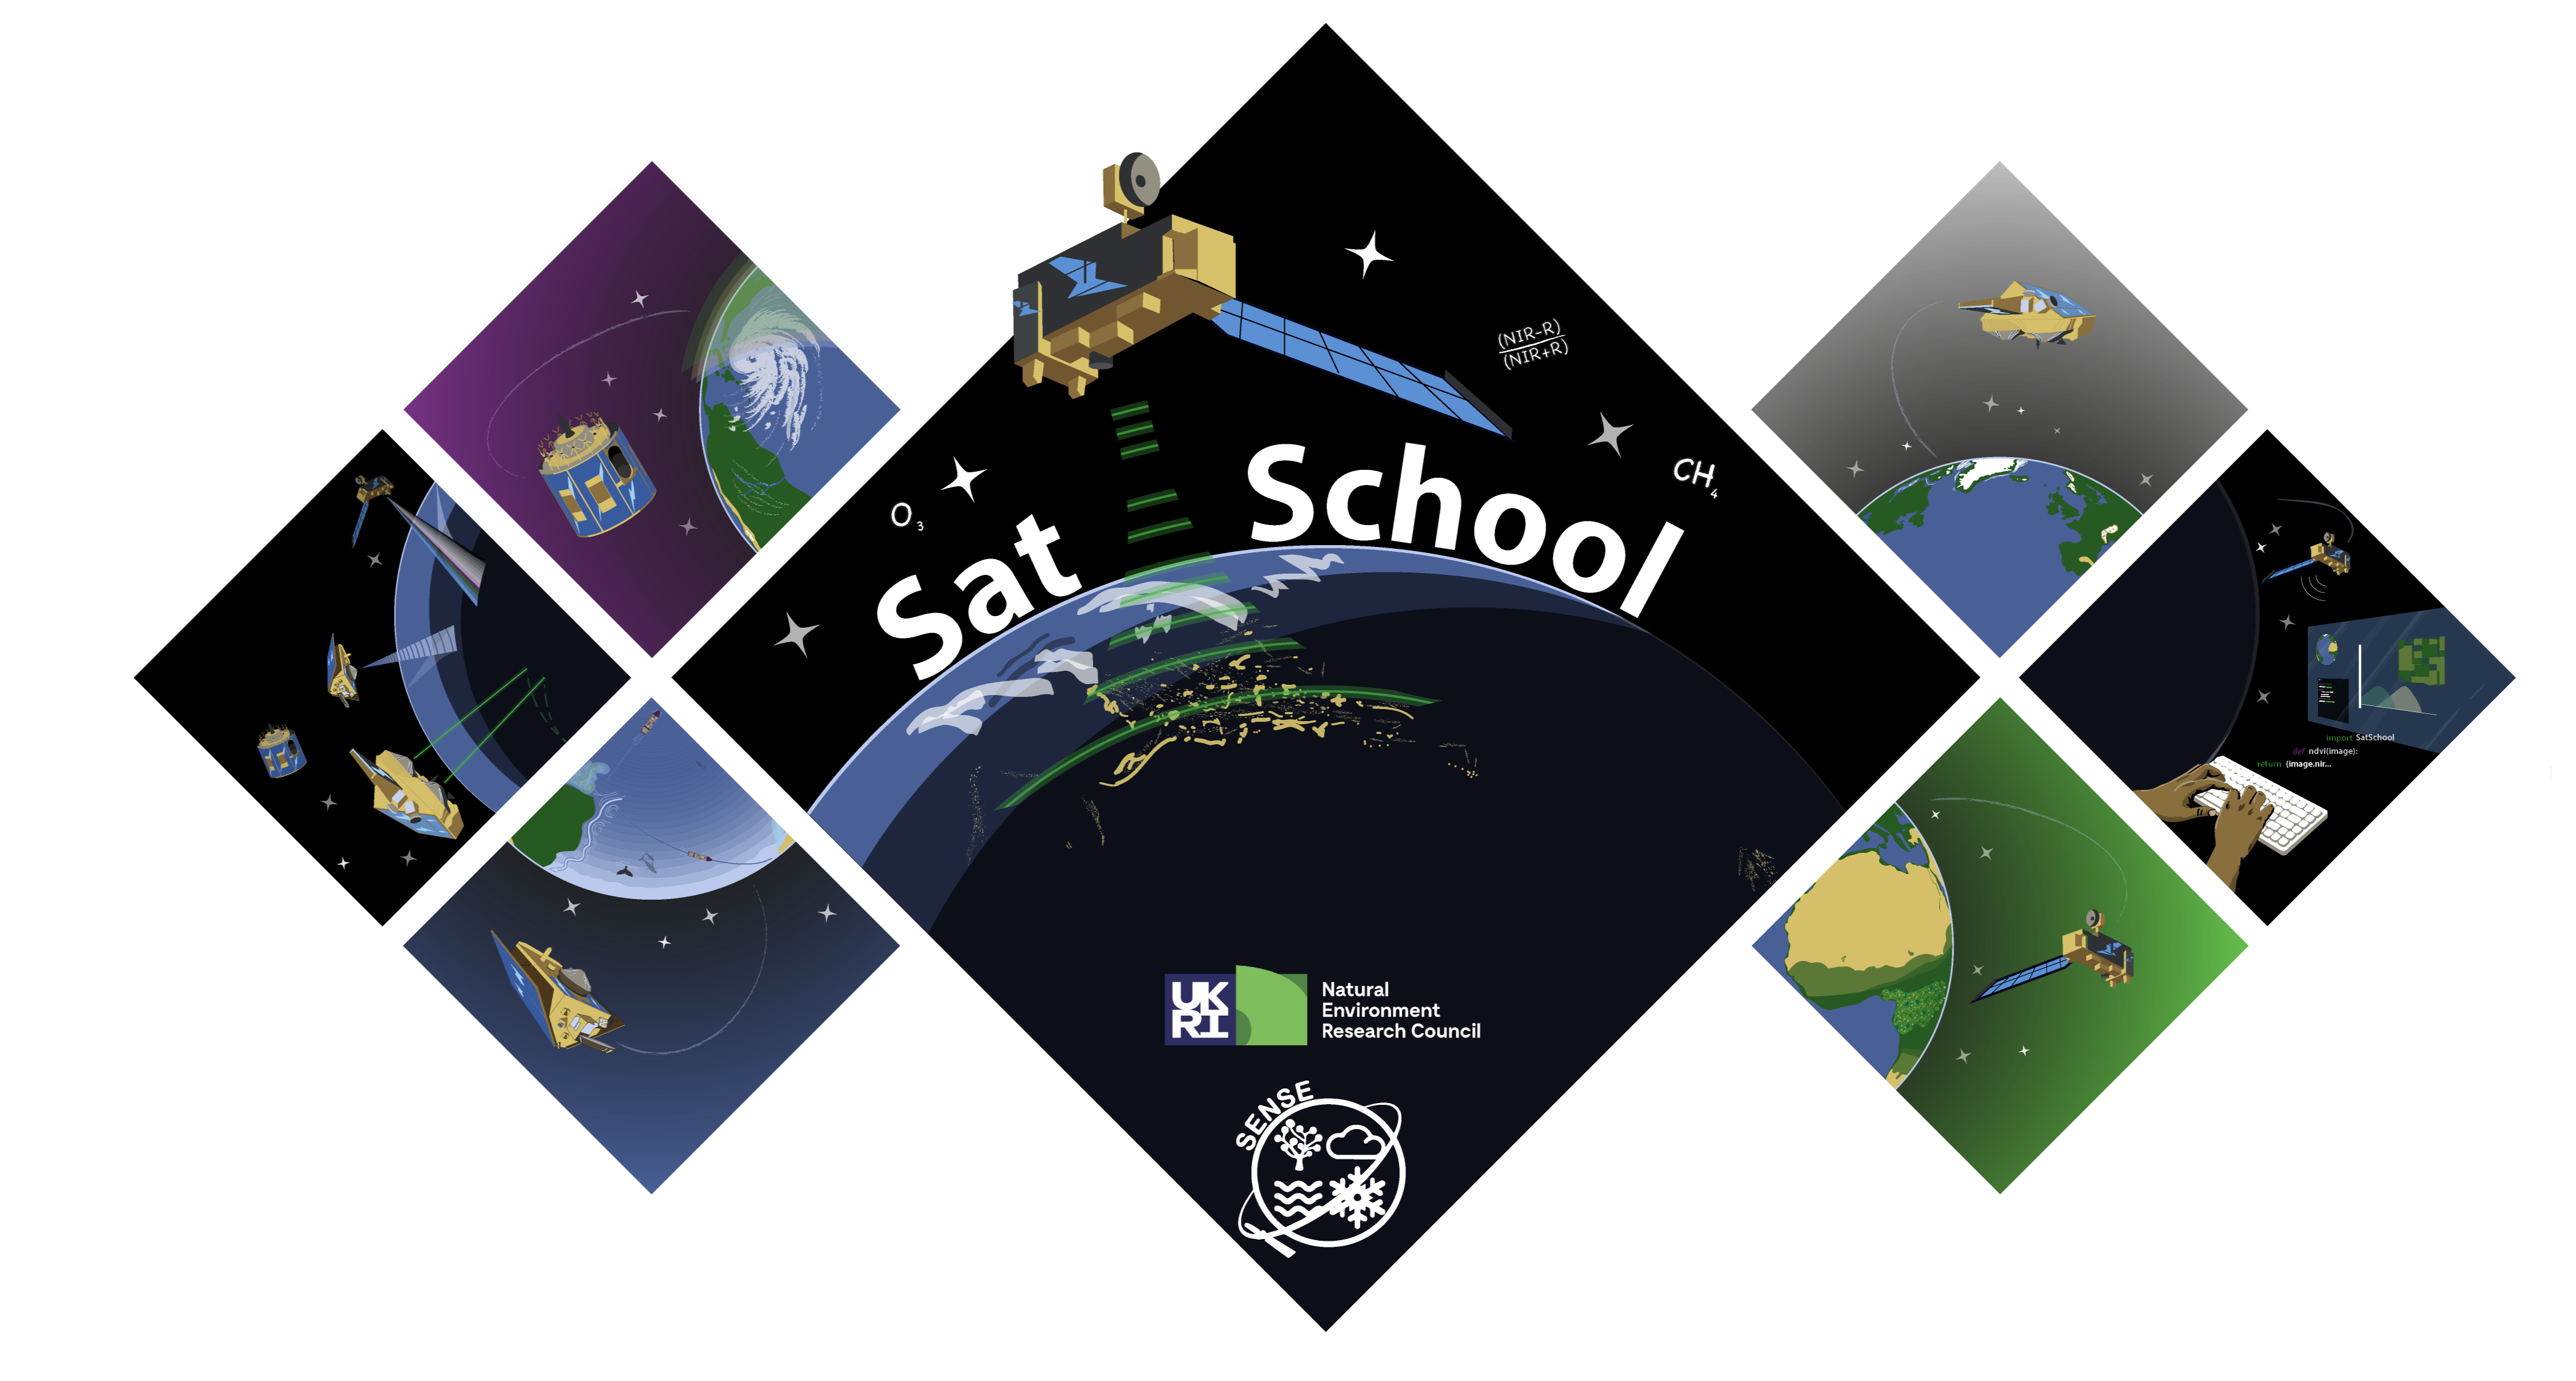
SatSchool
SatSchool is a programme designed by PhD students from SENSE. Although initially aimed at slightly younger students, the six modules, each containing 2–4 hours of presentations and interactive activities, do include that appear in GCSE/Highers specifications. They were also designed for self-guided learning, so would be appropriate for students of this age working independently. The six modules are:
- Introduction to Earth Observation
- Hands on with Data
- Cryosphere
- Biosphere
- Atmosphere
- Oceans
Climate detectives
The ESA Climate Detectives programme challenges teams of 2–30 students aged up to 19 years old, supervised by a teacher or mentor, to:
- identify a an environmental or climate problem
- investigate the problem using Earth observation data or/and data collected locally
- share results and make a difference.
Registration opens in September each year, plans need to be submitted in January, and project reports and conclusions in April. ESERO-UK provides support to teams, including training for teachers and feedback on plans.

ESA Education resources
Many European Space Agency Education Office resources are related to Earth observation and climate science. The following are particularly relevant:
- The greenhouse effect and its consequences
- After the storm (weather, disaster response)
- Sea ice from space
- Highways of the ocean (ocean circulation and currents)
- Infra-red webcam hack
Pack includes: varies
Download from: ESA | Teach with space – secondary classroom resources
Education Resources
Earth observation data, images and contexts are a great way of delivering parts of the core curriculum in a new way.
You do not have to prepare lessons using them for yourself: there are a growing number of ready-to-use resources available that contain everything you need to give it a go.
