
News and Media
Climate changes at 2°C warming as seen in the UK Earth System Model

This NCEO-led joint study with UK Earth System Model (UKESM) developers showcases the changes in future climate at different Global Warming Thresholds (GWTs) as seen in projections made with the UKESM1 model.
In this study, we first investigated the likelihood of meeting a key goal of the 2015 Paris Climate Agreement, which is to keep global warming less than 2°C above pre-industrial values by the end of the century.
We then further analysed climate projections from UKESM1 to better understand the regional and seasonal changes that take place when the Earth reaches different global warming thresholds.
The results, published in Journal of Climate, will be useful for assessing the societal impacts associated with different levels of global warming. Our findings will also feed into discussions on the urgency of mitigation action to increase the likelihood of staying below 2°C warming.
To find out when we are likely to exceed specific warming thresholds in the future, we use climate projections from Earth system models in the Sixth Coupled Model Intercomparison Project (CMIP6), which constitutes the most recent set of Earth system model projections made by models developed across the world [Eyring et al. 2016].
For a given year in the future, we measure how much the global mean surface temperature has changed from pre-industrial conditions; that is how much warming we see due to human activities. For our analysis, we used historical temperature simulations from 1850-1900 to represent pre-industrial conditions. In order to sample a range of possible futures that might arise from different societal policies and human activities, as well as climate system feedbacks, we force UKESM1 with a range of greenhouse gas emission and land use change scenarios arising from the so-called Shared Socioeconomic Pathways (SSPs) [Riahi et al. 2017].
Specifically, we sample four SSPs, labelled:
- for a Sustainable and Green future
- for Middle of the Road changes
- for a future dominated by Regional Rivalry
- for a Fossil Fuel Intense development
The SSPs are followed by a value (in units of W/m2) for the global mean top of the atmosphere (TOA) net radiation perturbation in each SSP at 2100 (e.g., 1.9, 2.6, 4.5, 7.0, 8.5 etc in W/m2) [O’Neill et al. 2016]. So, SSP1-2.6 is a future pathway that follows the guidelines for a sustainable and green future along with any additional mitigation efforts needed to keep the global mean, net TOA radiation perturbation at 2.6 W/m2 in 2100.
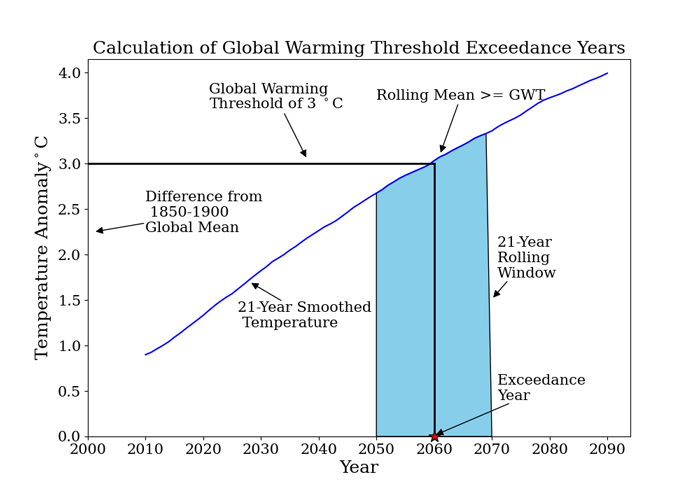
Figure 1 illustrates how we calculate the year in which a specific GWT value such as 3°C will be exceeded under a given scenario.
How likely are we to exceed 2°C warming before 2100?
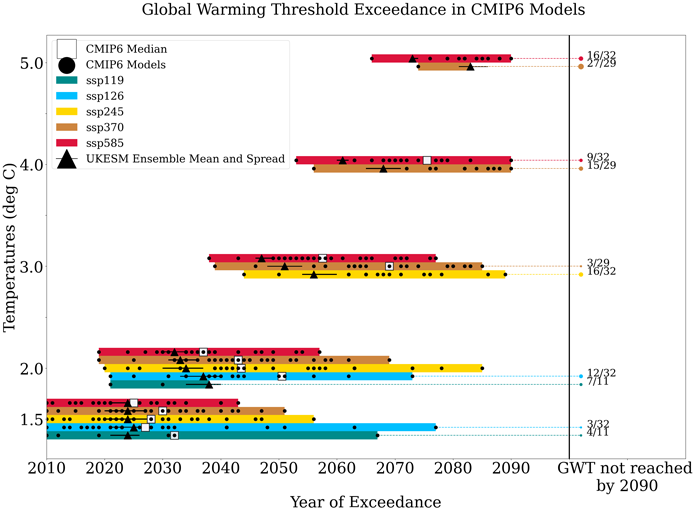
We used data from 32 models and a range of scenarios from the lowest to highest emissions from each model* and calculate the year each GWT is exceeded for each model and SSP, as shown in Figure 2. Except for the two emission scenarios based on SSP1, a GWT of 2°C is exceeded by all models by the end of the century. Some of the models, including UKESM1, exceed 4°C and even 5°C under the highest emission scenarios.
Overall, the CMIP6 projections are consistent with the expectation that sustainable growth scenarios with mitigation, such as SSP1-2.6, limit the amount of warming over the next century as opposed to fossil fuel intensive energy usage scenarios such as SSP5-8.5 where half the models exceed 5°C by the end of the century.
*SSPs 1-1.9, 1-2.6, 2-4.5, 3-7.0, 5-8.5
What does the world look like at 2°C warming?
Next, we looked at regional changes in key climate variables such as temperature, precipitation and soil moisture at different GWTs. For this we use the UKESM1 SSP3-7.0 ensemble (i.e. a Regional Rivalry scenario) and average results across available members. Figure 3 shows the 21-year mean temperature changes centred on the year the 2°C threshold is exceeded in the UKESM1 ensemble and the difference between a 2°C and 4°C global warming. We see that not all regions warm equally — the Arctic for instance, warms considerably more than the rest of the world, with important consequences for sea ice in the region.
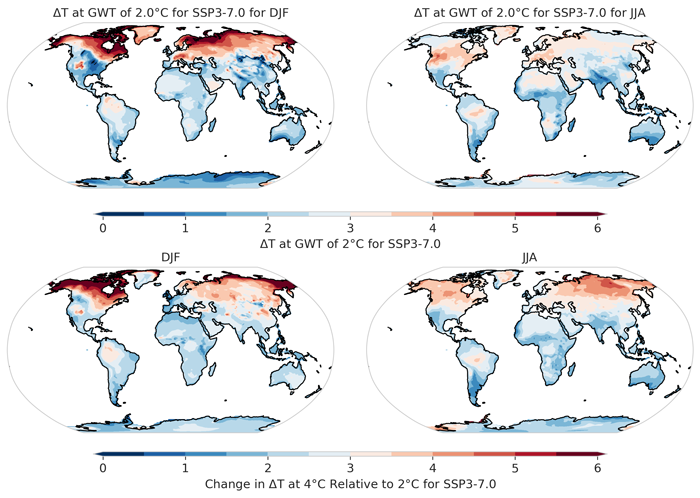
UKESM1 projections predict the Arctic will be almost entirely ice free in summer if we reach 3°C warming, further contributing to a warming amplification in the region. The northern high latitude regions warm by almost twice the global mean in the December-January-February (DJF) season while the June-July-August (JJA) season saw warming increased by a factor of 1.5 in parts of Europe and the Mediterranean, the Amazon and south west Africa.
While all land regions in the world show an increase in temperature with an increase in global mean warming, not all changes seen in the simulations were linear for instance, northern Europe and Siberia in the JJA season saw a greater warming going from 2°C to 4°C than from pre-industrial to 2°C, suggesting local amplification of the warming signal.
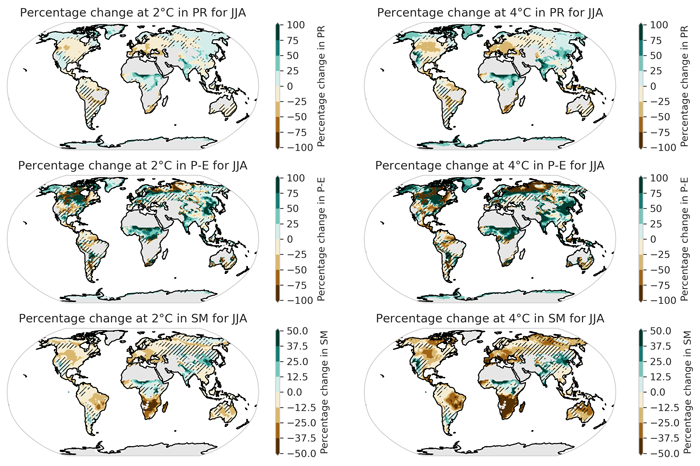
This regional warming is typically accompanied by a decrease in precipitation leading to strongly emerging drying signals further exacerbated at a GWT of 4°C as seen in Figure 4. The Indian subcontinent, on the other hand, sees an increase in summer monsoon precipitation at 2°C global warming, which almost doubles at a 4°C warming. The increased monsoon rainfall will be one reason why the temperature increases are not so large over India in the summer monsoon season.
Additional results and more details on our analyses can be found in our recently published paper [Swaminathan et al., 2022].
Broader impacts and future work
Work done for this study establishes a framework for us to expand on and study changes in climate at different GWTs using a multi-model, multi-emission scenario (SSP) setup. Further work is planned along these lines, as well as studies exploring the dynamics of specific regional changes, such as over the Amazon. This work can also facilitate studies of the societal impacts arising at different global warming levels. We have successfully showcased this research at the COP26 meeting in November 2021 at Glasgow as part of NCEO and UKESM efforts to improve the public’s understanding of climate change.
Associated projects, programmes and funders
This research was supported by funding from the National Environment Research Council through the National Centre for Earth Observation (NE/N018079/1), the UK Earth System Modeling Project (NE/107951/1), National Capability UKESM Grant (NE/N017978/1) and the EU Horizon 2020 project CRESCENDO grant no. 641816.
About the author
Contact Dr Ranjini Swaminathan for further information
Department of Meteorology and the National Centre for Earth Observation at the University of Reading
Share this article


Published by Fazila Patel
Digital Communications Officer
University of Leicester
Latest News and Events


