News and Media

Satellite data reveals source of increased global atmospheric methane between 2020-2021
A new paper has been published this week in the European Geosciences Union journal Atmospheric Chemistry and Physics that addresses the causes of the unprecedented increase in global atmospheric methane in 2020 and 2021.
Changes in atmospheric methane can be caused by changes in surface emissions or atmospheric chemistry. Emission sources are from human activity (e.g., agriculture and fossil fuel combustion) and from the natural world (e.g., wetlands). The loss of atmospheric methane is mainly oxidation by the hydroxyl radical (OH), the dominant oxidant in the lowest part of the atmosphere.
Scientists from the National Centre for Earth Observation (NCEO) based at the University of Edinburgh and the University of Leicester (UoL) used satellite data from the Japanese Greenhouse gases Observing SATellite (GOSAT) to estimate methane surface emissions and changes in OH that help explain the observed increase in atmospheric methane.
Changes in climate has knock-on effects across the Earth system. Without satellite data, we would be effectively blind to the origin of many of these changes and scientifically poorer for it.
Professor Paul Palmer, NCEO Science Director at the University of Edinburgh.
Recent studies have identified an important role for OH to explain the unexpected surge in atmospheric methane during the Covid lockdowns in 2020. Massive-scale reductions in industrial activity during earlier lockdowns decreased emissions of nitrogen oxides and subsequently, through atmospheric chemistry, decreased atmospheric levels of OH. Decreasing the loss of atmospheric methane leads to rising levels of atmospheric methane.
Even during a time of massive-scale human upheaval, satellites continue to provide invaluable information to help track changes in methane emissions across the globe. In this case, satellite data have helped us to reveal the atmospheric implications of shutting down global industries in 2020 and the continued emissions from the natural world.

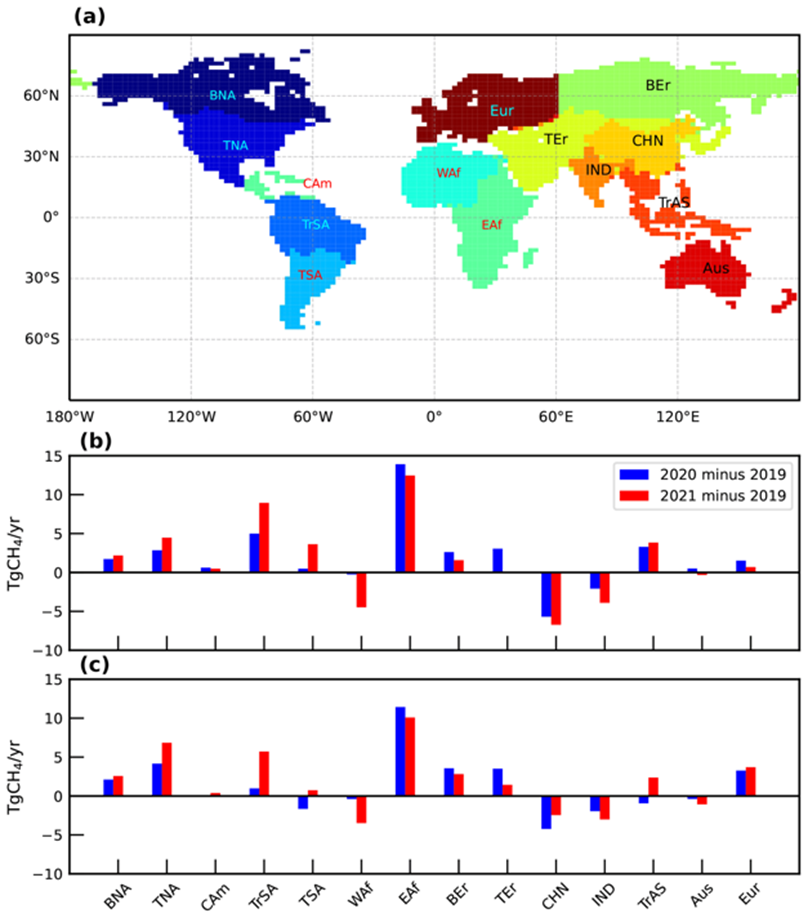
Using GOSAT observations, the NCEO team at UoL generate an important global atmospheric methane dataset. The NCEO team at Edinburgh were then able to use this data to provide robust estimates for both methane emissions and changes in OH. They found that the OH decrease 2020 explained about a third of the increase atmospheric methane but played a much smaller role in 2021. In both years, emissions from Eastern Africa, where we know emissions from wetlands dominate, play a large role in explaining observed changes in atmospheric methane.
This result shows again the high value of the satellite-derived methane dataset that we generate as part of NCEO. The capability to generate this consistently high-quality data over a long time period allows us to monitor such changes and trends and better understand the direction in which we’re heading.
Dr Rob Parker NCEO at the University of Leicester
This new study, led by Dr Liang Feng and Professor Paul Palmer from NCEO at the University of Edinburgh, highlights the critical value of using satellite observation to understand the rapid changes in atmospheric methane. They provide crucial information to identify regional hotspots for methane emissions and data to help us link these hotspots to specific anthropogenic and natural sources.
Read the full paper in EGU here – https://acp.copernicus.org/articles/23/4863/2023/.
Latest News and Events


